
Housing EDA
This post will explain the exploratory data analysis that I did with the housing data I had previously collected.
Question
I wanted to look into the Utah housing market, and see if I could identify what features/components of a house had the biggest impact on price, and which ones might be most important for predicting the houses value. To achieve this, I collected data, detailed here, and proceed to explore the data and see what stood out to me. Does the square footage of the house have a large impact? Does the type of dwelling? How does the amount of land/property that dwelling has impact the price? Where do most house prices seem to fall? All of these questions and more were in mind as I looked through the data, and I will highlight some of what I found interesting. You can also see this information in a streamlit dashboard here, where there is some more interaction with the charts you can have to explore the data yourself.
EDA
To start out, I wanted to get a general feel for the distribution of the housing prices from what I was able to scrape via Selenium. The distribution of housing prices is fairly skewed, which was expected, as I pulled houses starting with the highest prices, so the lower prices aren’t reflected very well here. But we can still get a feel for how the prices are generally spread.
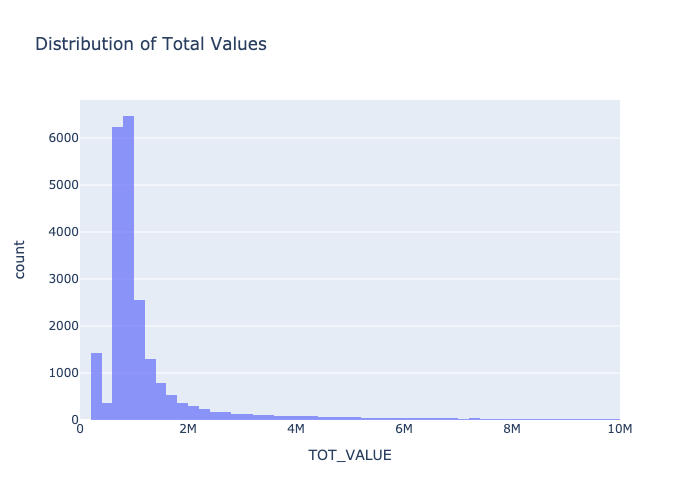
From this, we see a large spike around $700,000 - $1,000,000, where most of the houses that I loaded seem to be found. This made me also want to get a feel for how many of each type of dwelling was represented in the distribution, which we can see in the following chart.
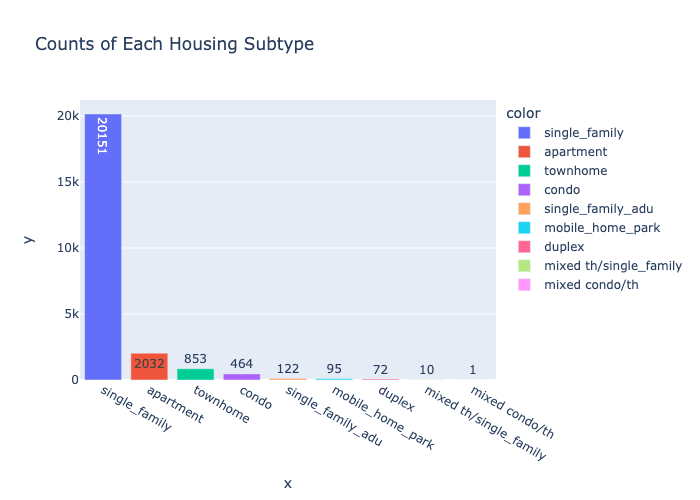
Somewhat expectedly, the overwhelming majority of dwellings were single family dwellings, as that is what is most prevalent, followed by apartments and townhouse which are also rising in popularity it feels like. To start looking at more variables, I wanted to get a feel for if any had a higher correlation with each other, so I made the following heat map to explore this.
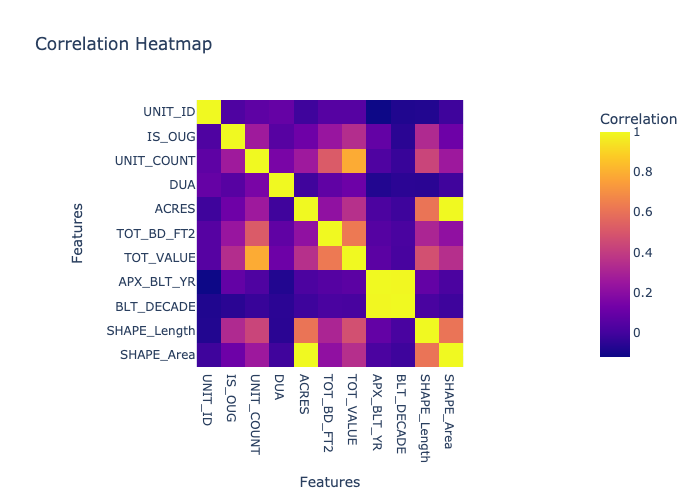
There is a lot of information there, but I will be focusing on some highlights. If you want to explore more, there is an interactive version of this chart on the dashboard linked at the beginning. Focusing on the TOT_VALUE field, it seems to have the highest correlation with the square footage and unit count of the dwelling, which would make some sense, and things like apartment building and condo buildings would be more expensive than just a single family house. This made me want to look a bit into how the different types of dwellings might impact things like acres of the property, so I created a scatter plot that shows how the amount of acres and the price impact each other, colored by their type.
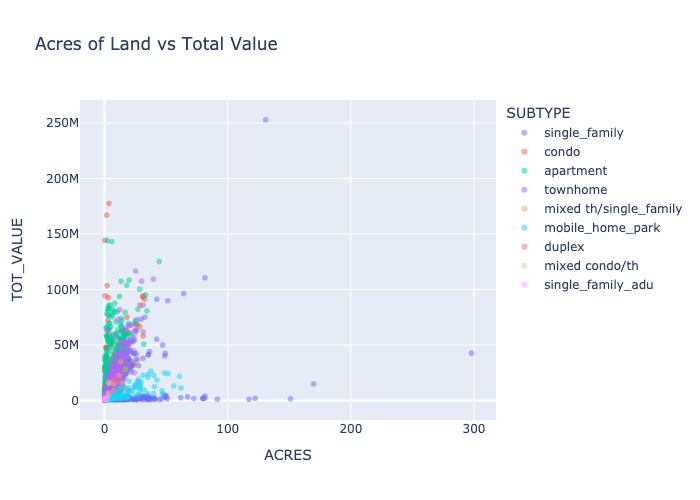
I found this visualization to highlight some very interesting things. We see a lot of the dwellings of the same types clustered around each other, following a similar pattern based on the type of dwelling, which does follow what I would think. It is much easier for a single family house to have more land without impacting price too much, especially compared to apartment building or condos, which seem to have steep increases in price for little increases in acreage. This then lead me to consider what the relationship between price and the square footage of the house.
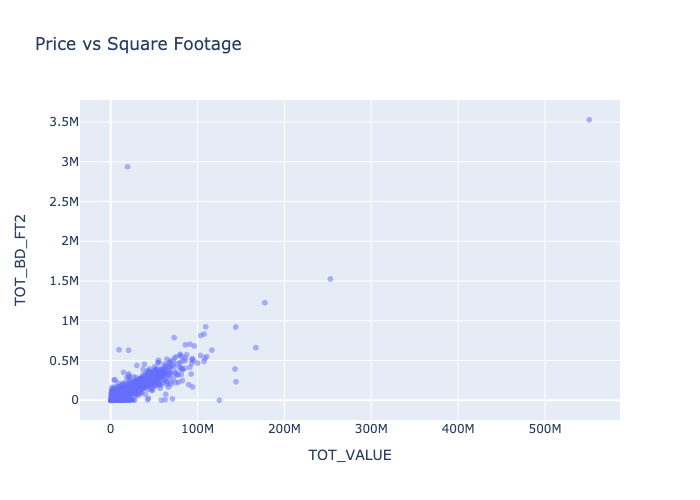
This did follow what I would think, that there is a pretty clear relationship between the price of the house, and how much square feet the house has. In general, there is very little variance, so the type of dwelling or other factors such as location don’t seem to be very relevant to this relationship. One final aspect I wanted to explore some was if there was any relation between when the house was built and its price.
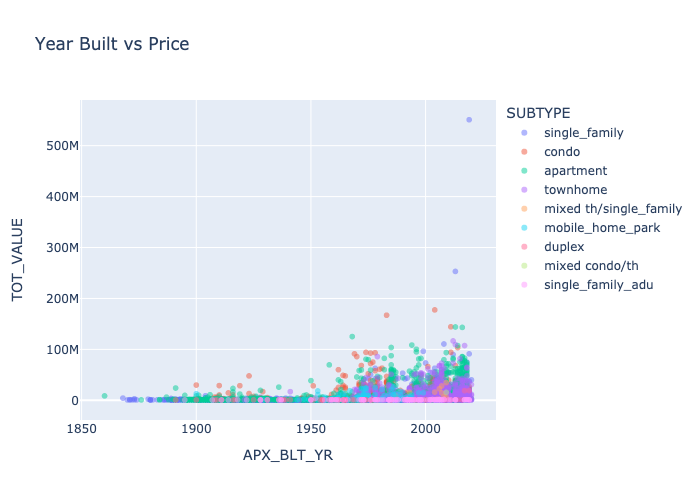
Looking at this scatter plot, there are a few interesting things to note. One thing I noticed was that over the more recent years, there has been a good amount more of condos and apartment buildings being built. I also found it interesting that it was really only within the last few decades that house prices have started getting very high. This is certainly understandable though, as inflation leads to higher prices of everything, and in recent years, it is easier and more common for people to have larger amounts of money available, and thus being able to afford and want nice and more expensive homes.
Conclusion
At the end of this analysis, there have been many interesting things I have learned. There are many factors that all contribute to housing prices, but there are some like square footage that clearly have a more direct relationship. There is still plenty more to explore with this data, as well as seeing if we can build a model that would help us estimate the price of a house with certain features. If you want to see the code and the data I used for this post, you can go to my repository to see more details.